Rolls and Profiles
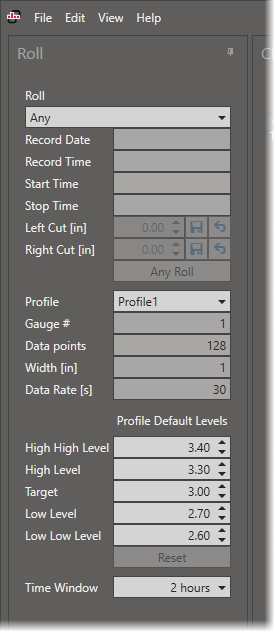
Select different rolls or profiles on the left hand side of the main window.

Roll Selection
If no roll reports are configured then only “Any” rolls are available in the selection and the chart will display information based on profile data only.
If roll data is available then a roll can be selected from the dropdown and the following roll information is displayed:
Record Date
The date portion of the “sample_datetime” field saved by Dataristix or OPC Office Link for the roll data sample.
Record Time
The time portion of the “sample_datetime” field saved by Dataristix or OPC Office Link for the roll data sample.
Start Time
The roll start time, taken from the roll report.
Stop Time
The roll stop time, taken from the roll report.
Left Cut
If the left cut value is other then zero then a line is displayed in the chart at the cut position. If a Roll Cuts Table is configured then the modified value can be saved to the database.
Right Cut
If the right cut value is other then zero then a line is displayed in the chart at the cut position. If a Roll Cuts Table is configured then the modified value can be saved to the database.
Tip
You can modify left and right cut values using the mouse wheel or you can set a cut value within the heatmap chart by pressing the left mouse button in combination with the Shift-Key.
When a roll is selected then charts will only display profile data falling within the roll’s start and stop times and the roll’s high, target, and low level values will be used for chart coloring, overriding the profile’s default values.
Click on the “Any Roll” button to clear the roll selection.
Profile Selection
Select a configured profile from the dropdown for charting. The following values will be displayed for the selected profile.
Gauge #
The configured gauge number of the profile.
Data Points
The number of data points across one sample as determined at configuration time.
Width
The phsyical width of the profile as configured.
Data Rate
The expected data rate in seconds (how often new samples are expected to arrive).
High High Level
This is the profile’s configured High High Level value. You can change the value and interactively observe chart updates. The value change is not permanent and reverts back to the configured value either when selecting different rolls or profiles or when the “Reset” button is pressed.
High Level
If no roll is selected then this is the profile’s configured High Level value. If a roll is selected then this is the roll’s High Level value, taken from roll data.
You can change the value and interactively observe chart updates. The value change is not permanent and reverts back to the configured value either when selecting different rolls or profiles or when the “Reset” button is pressed.
Target
If no roll is selected then this is the profile’s configured Target value. If a roll is selected then this is the roll’s Target value, taken from roll data.
You can change the value and interactively observe chart updates. The value change is not permanent and reverts back to the configured value either when selecting different rolls or profiles or when the “Reset” button is pressed.
Low Level
If no roll is selected then this is the profile’s configured Low Level value. If a roll is selected then this is the roll’s Low Level value, taken from roll data.
You can change the value and interactively observe chart updates. The value change is not permanent and reverts back to the configured value either when selecting different rolls or profiles or when the “Reset” button is pressed.
Low Low Level
This is the profile’s configured Low Low Level value. You can change the value and interactively observe chart updates. The value change is not permanent and reverts back to the configured value either when selecting different rolls or profiles or when the “Reset” button is pressed.
Time Window
The time window determines how much data is rendered in the heatmap across the time axis. A larger time window renders more data but puts higher demands on the system. A smaller time window renders less data at once and more scrolling is required to view the same amount of data.
By default, the time window is set to two hours.