Configuration
The configuration dialog is shown after first starting Profile Historian or any time by selecting “File / Configuration” from the main menu.
Note
If your gauging system vendor has provided you with a Profile Historian configuration file then you can cancel the initial configuration dialog and import the provided configuration file. If you have not received a configuration file then please contact us. Refer to the deployment guide for further details.
ODBC Data Source
Profile Historian needs to know where Dataristix or OPC Office Link is storing profile data.
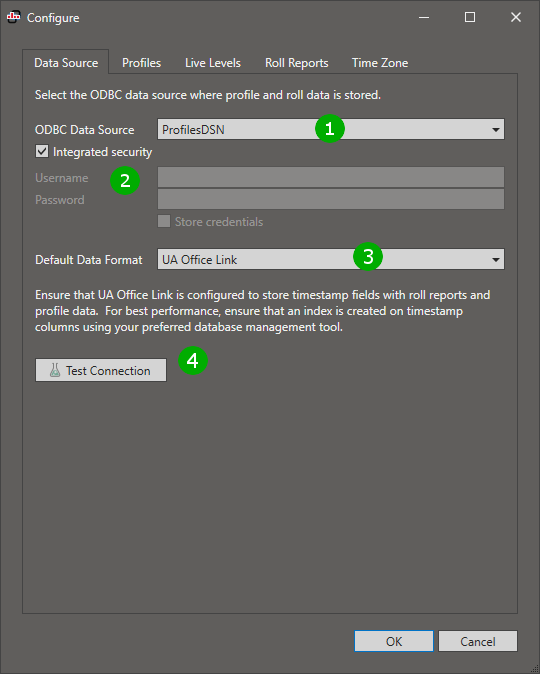
( 1 ) Select the ODBC data source name from the dropdown. If the expected data source name is not listed then use the Windows ODBC administrator to configure the data source (press the Windows Start button and type “Data Sources” to find the ODBC Data Source administrator). Note that Profile Historian is a 64-bit application and requires a 64-bit data source. The data source may be configured as a User DSN or as a System DSN.
( 2 ) If the data source does not require further login details (because you, as the interactive user, have access to the database) then tick the “Integrated Security” option, otherwise you will be prompted for database credentials later. If the database requires login information then you have the option to enter username and password and to “Store credentials” for future use. Credentials are stored in encrypted form.
( 3 ) Select the expected data format. For Dataristix “sample_datetime” table fields are expected in UTC whereas local time is expected for OPC Office Link.
Important
In both cases it is advisable to ensure that an index for the “sample_datetime” or other timestamp field is created using your database administration tool; this will significantly speed up access to profile data.
( 4 ) Test the connection to ensure that Profile Historian can access the database.
Profiles
Once Profile Historian can successfully connect to the data source, Profiles can be configured. A profile refers to an OPC array tag as sampled by Dataristix or OPC Office Link. If profiles have not been configured before then a blank profile configuration is shown.
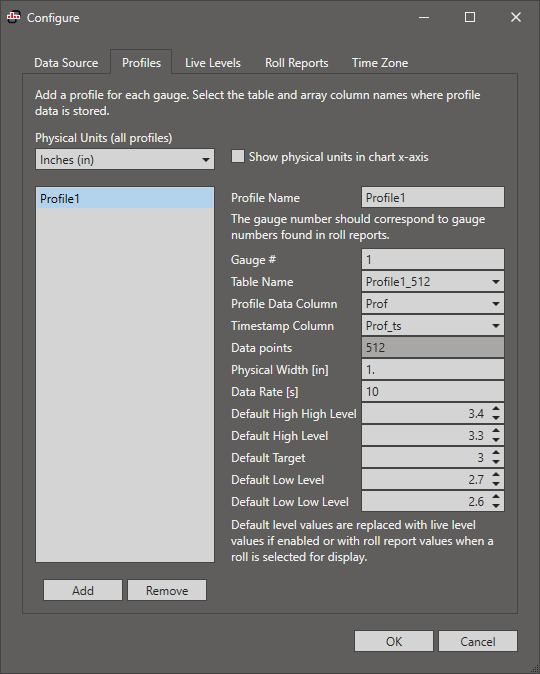
Enter or review the following details to configure the profile:
Physical Units (for all profiles)
The phyiscal unit (inches or centimeters) that is displayed in profile information when referring to the profile width.
Show physical units in chart x-axis
If ticked, then the chart x-axis will show labels ranging from zero to the configured physical width of the profile; if left unticked then the data point index ranging from zero to the number of samples across the profile is displayed.
Profile Name
A name of your choice to refer to the profile.
Gauge #
The number of the gauge the profile is associated with.
Table Name
The table in the database where Dataristix or OPC Office Link is storing profile information. The dropdown will show database tables to choose from (you will need sufficient database access rights to list tables). Table names must not contain characters other than alpha-numeric characters and underscore characters.
Profile Data Column
A array column within the database table that is storing the array values (you will need sufficient database access rights to list table columns). In general it is expected that each profile is stored into its own table with only one column shown. Column names must not contain characters other than alpha-numeric characters and underscore characters.
Timestamp Column
The timestamp associated with the profile data. This may be the ‘sample_datetime’ column generated by Dataristix or OPC Office Link or, preferably, a timestamp column ending with ‘_ts’, containing timestamps originating from the underlying OPC server. Column names must not contain characters other than alpha-numeric characters and underscore characters.
Data Points
The number of array element columns; this field will be filled automatically based on the detected array length.
Physical Width
The physical width of the profile measured in the configured phyical units.
Data Rate
This is the expected rate at which new sets of array values will be stored into the database. For example, if the gauge provides a new measurement every 30 seconds then the data rate should be 30. This field may be filled automatically based on the recently detected samples stored in the database. The value is used to scale the time axis in the heatmap chart to display a continuous surface.
Default High High Level
The heatmap chart displayed by Profile Historian will change color when a measured array value exceeds the configured high high level. This value may be replaced by Live Level data, if enabled, or with roll data when a roll is selected. Chart colors and levels will then be displayed observing the replaced high high level value instead.
Default High Level
The heatmap chart displayed by Profile Historian will change color when a measured array value exceeds the configured high level. This value may be replaced by Live Level data, if enabled, or with roll data when a roll is selected. Chart colors and levels will then be displayed observing the replaced high level value instead.
Default Target
The target value is the optimal value for the measured thickness. This value may be replaced by Live Level data, if enabled, or with roll data when a roll is selected. Chart colors and levels will then be displayed observing the replaced target value instead.
Default Low Level
The heatmap chart displayed by Profile Historian will change color when a measured array value falls below the configured low level. This value may be replaced by Live Level data, if enabled, or with roll data when a roll is selected. Chart colors and levels will then be displayed observing the replaced low level value instead.
Default Low Low Level
The heatmap chart displayed by Profile Historian will change color when a measured array value falls below the configured low low level. This value may be replaced by Live Level data, if enabled, or with roll data when a roll is selected. Chart colors and levels will then be displayed observing the replaced low low level value instead.
You can configure multiple profiles and switch between them for charting later.
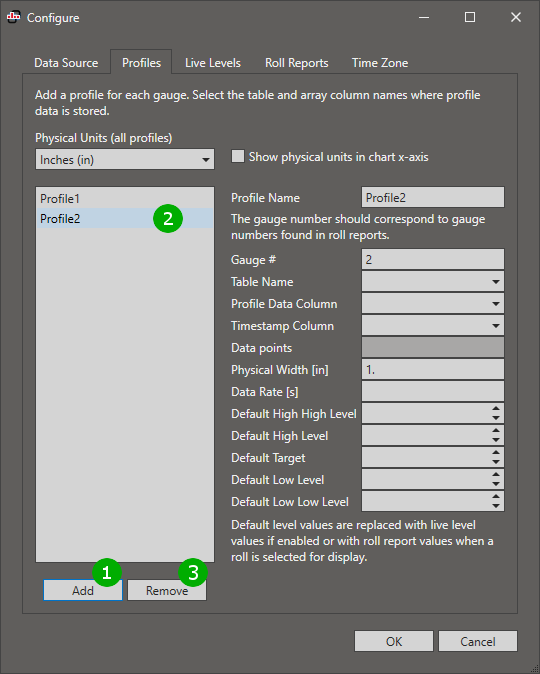
( 1 ) Press the “Add” button to add a new blank profile for configuration. The new profile’s properties will be displayed on the right.
( 2 ) Click on a profile name to change the selected profile’s configuration.
( 3 ) If a profile configuration is no longer needed then select the profile before clicking “Remove”.
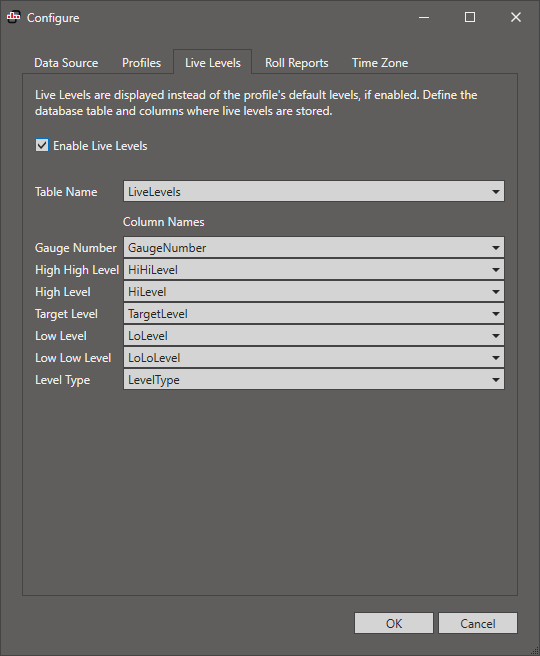
Live Levels
Profile Historian may be configured to display live threshold values. Tick the “Enable Live Levels” checkbox to enable Live Levels. Level values are continuously read from the configured database table fields and displayed on the left hand side of the main window under the selected profile, replacing any profile default values.
Configure the table name and field names where numerical values are stored. The table name and all column names must be defined. The gauge number field should be the primary key of the table.
Level values may be interpreted as absolute values, offset values from target or as an offset percentage from target, based on the value of the numeric “Level Type” field. A value of zero will interpret level values as percentage offsets, a value of one will interpret level values as offset values, and a value of two will interpret level values as absolute values. Please see the next section for examples of the different level types.
Roll reports
Optionally configure roll reports for display of historic roll data or for interactive charting using specific roll targets and limits. Initially no roll reports are configured.

Select a different roll report format to configure roll reports for that specific format.
To add a format, click the “Add” button. This will open a file selection dialog to load a roll data format definition file. If a roll format with the same name has previously been added then the new file will overwrite the old one.
Note
If you have not received a roll data format definition file from your gauging system vendor then please contact support@rensen.io for possible integrations.
If a roll data format is no longer needed then you can delete it from the list by pressing the “Delete” button.
Once a roll data format is selected the following additional features are available.
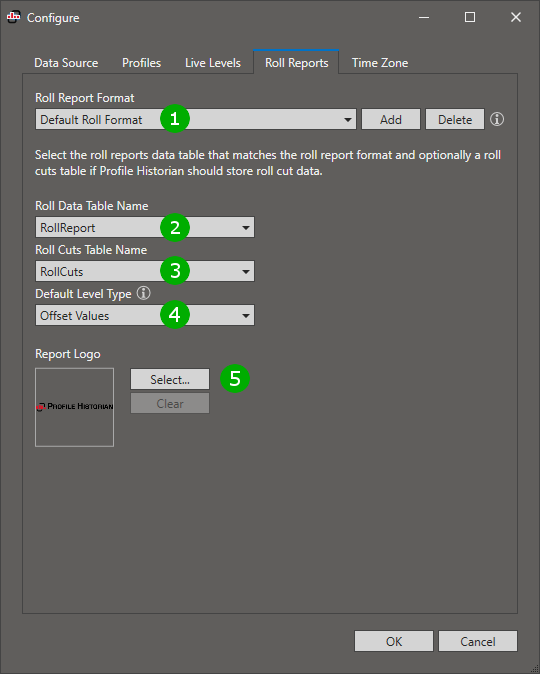
( 1 ) The name of the selected roll data format definition is displayed.
( 2 ) Roll Data Table Name
Select the table name where roll data is stored in the format defined by the roll data definition. You can also enter the name of a table or database ‘view’ manually. An error is reported if the data table does not match the definition. Table names must not contain characters other than alpha-numeric characters and underscore characters.
( 3 ) Optionally select a Roll Cuts Table Name
The roll cuts table is used to store interactively determined roll cut values. The table name must not contain characters other than alpha-numeric characters and underscore characters.
This may be a different table or the same table as the Roll Data Table provided that the roll data table already contains the required fields. Required fields are: Id, LeftCut, RightCut. Id refers to the roll data row ID, LeftCut and RightCut need to be floating point data columns to hold set cut values (distance across the profile width in physical units).
If the Roll Cuts Table is different from the Roll Data Table then the Roll Cuts table is joined onto the Roll Data Table by the given row ID and values are stored in the separate Roll Cuts Table. If the Roll Cuts Table is the same as the Roll Data Table then cut values are stored in the same row as the rest of the roll data; LeftCut and RightCut fields must be present but must not be part of the roll data definition.
( 4 ) Select a default level type
If roll reports do not contain level type information for alarm or alert values (for example, for high level or low level values) then level values stored within reports are interpreted according to the Default Level Type setting. Options are:
Offset Percentages
The level values found in reports are interpreted as percentage numbers, defining an offset from the target value. For example, if the report contained a target value of 3.0 and a High Level value of 10 then this is interpreted as a 10% offset from the target of 3.0; the absolute level value would then be calculated as 3.3.
Offset Values
The level values found in reports are interpreted as offset numbers, defining an offset from the target value. For example, if the report contained a target value of 3.0 and a “Low Level” value of -0.3 then this is interpreted as an offset of -0.3 from the target value of 3.0; the absolute level value would then be calculated as 2.7.
Absolute Values
The level values found in reports are interpreted as absolute values, independent from the target value.
( 5 ) Select a report logo
The report logo appears in the top right corner of Roll Reports. Select an image file to replace the default image.
Time Zone
Chart times are displayed in the time zone of the computer where Profile Historian runs. Configure how daylight saving bias is handled and select from the following options.
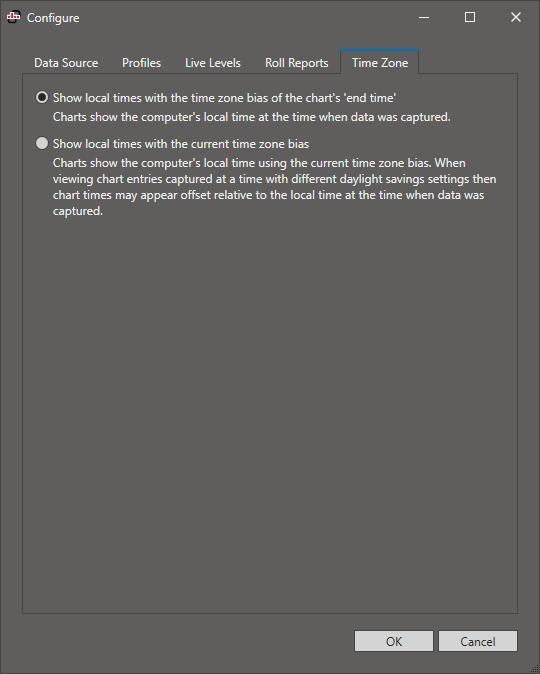
- Show local times with the time zone bias of the chart’s ‘end time’
- This is the default; charts show the local time at the time of data capture, adjusted for the daylight saving bias at that time. If the chart time bias is different from the current time bias then the chart’s time zone is displayed underneath the time window selector.
- Show local times with the current time zone bias
- Charts show local times with the daylight saving bias as it currently applies. When looking back at times with a different daylight saving bias then data may appear offset relative to the local time at the time of data capture.
Labels
Labels as displayed within the user interface for threshold levels and “gauge” may be adjusted by selecting the “Appearance” tab at the bottom left of the main window. This feature may be used to change the default terminology to something more familiar within the context of the gauging system in use.
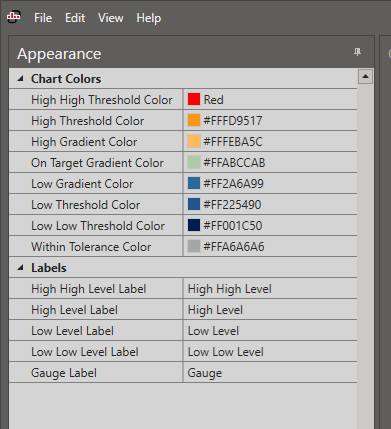
Select menu “View / Restore default appearance” to restore original settings.
Import / Export Configuration
Use “File” menu “Export Configuration” to save the current configuration to a file or use “Import Configuration” to load a previously saved configuration.
Warning
Importing a configuration will overwrite all current settings.