Telemetry
Dataristix Core version 2.0.75 or later integrates OpenTelemetry, optionally collecting traces, logs, and metrics to:
- Analyze performance bottlenecks in dataflow tasks.
- Monitor task metrices such as input, output or error counts.
- Aggregate logs from Core and Connector modules.
- Send your own metrics: Use the integrated Telemetry output connector to send results of your dataflow tasks to your preferred telemetry collector.
Telemetry is disabled by default. Go to the Configuration navigation node and select the Diagnostics tab to configure telemetry.
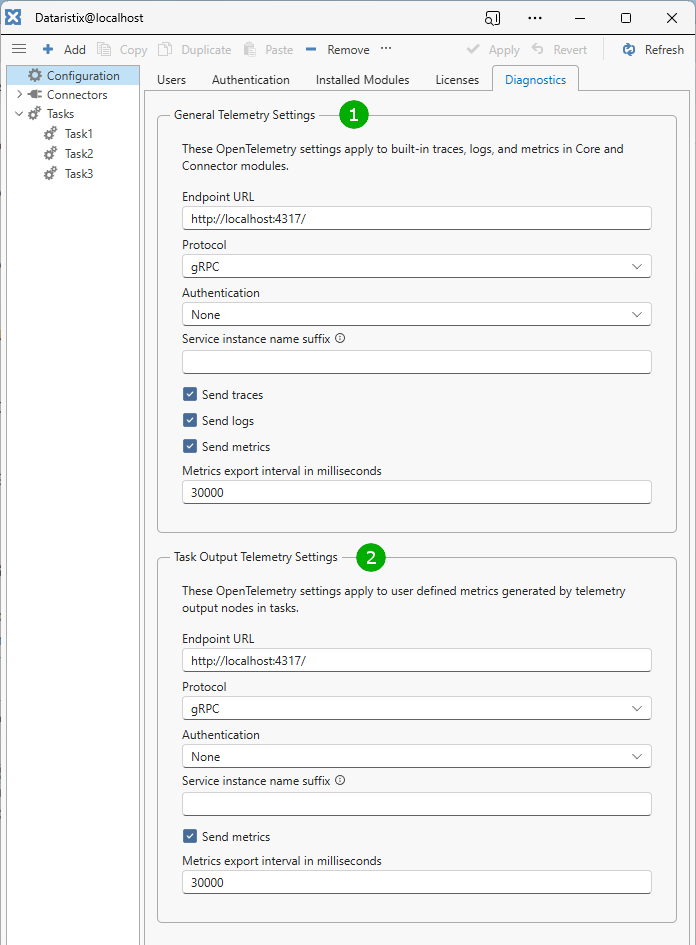
There are separate settings for built-in telemetry (1) and for user-defined telemetry as configured in tasks (2). You can send telemetry for both to the same or to separate endpoints.
Settings include:
- Endpoint URL
- The endpoint of your OpenTelemetry collector.
- Protocol
- The protocol to use for communications with your OpenTelemetry collector.
- Authentication
- If your collector requires authentication, then select the appropiate option here. Supported authentication methods are “Basic” username and password authentication and authentication via API key with configurable API key header name.
- Service instance name suffix
- When running multiple instances of Dataristix sending telemetry data to the same collector, then optionally enter an instance name suffix here to distinguish different instances in your visualization tool; for example, enter “@hostname” to distinguish a specific host.
In the “General Telemetry Settings”, you can separately enable or disable traces, metrics and logs. Task Output Telemetry consists of metrics only, which you can enable or disable globally here, preventing any task configured with the Telemetry output connector from sending telemetry.
Use the “Apply” toolbar button after making changes to the settings. The effect is immediate and does not require restarting of tasks.