Example
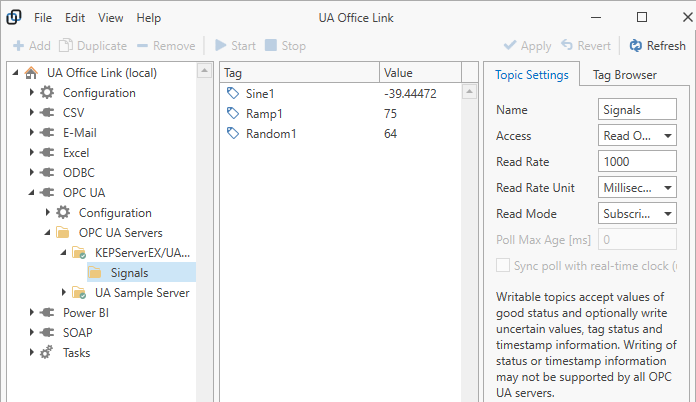
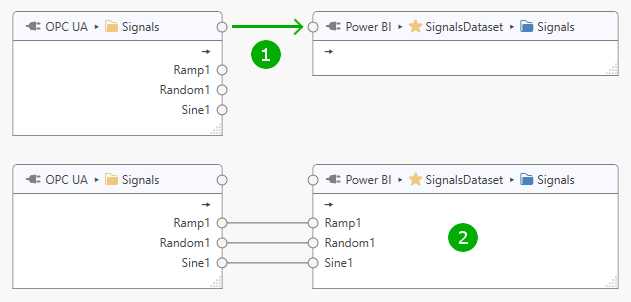
In this example, we want to send three numeric values originating from an OPC UA Server to Microsoft Power BI. For this purpose, we create a topic “Signals” for the OPC UA Connector and place the relevant tags “Sine1”, “Ramp1” and “Random1” into the “Signals” topic. Take note of the tag names as they are needed to configure a corresponding streaming dataset in Microsoft Power BI.
Review the topic’s read rate. If data changes quickly then data will be updated in Power BI at this rate. The update rate must not be too high so that each dataset update can be processed without accumulating many pending updates.
Sign in to Microsoft Power BI to configure a corresponding streaming dataset. If you do not have a Microsoft Power BI account then follow the steps to create a free account.
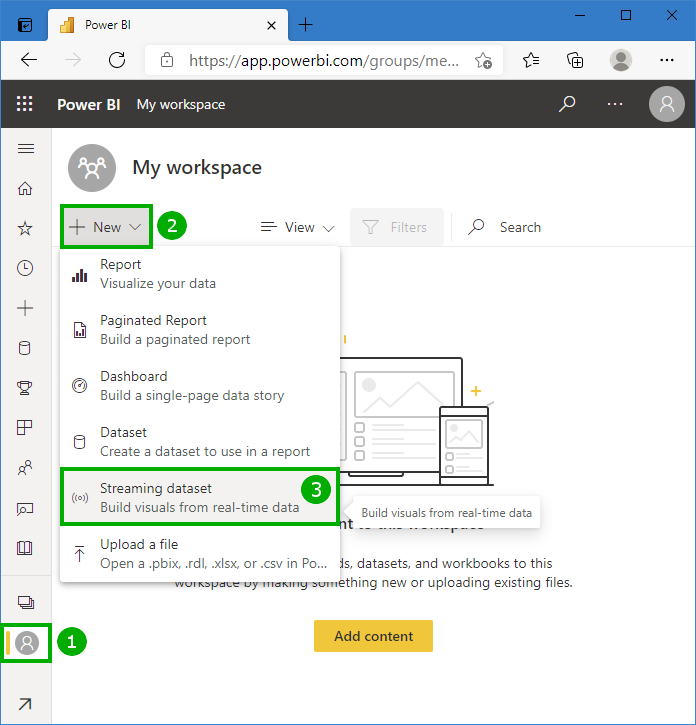
After signing in (see image below), locate “My workspace” (1), then drop down “New” (2) and select “Streaming dataset” (3) from the menu.
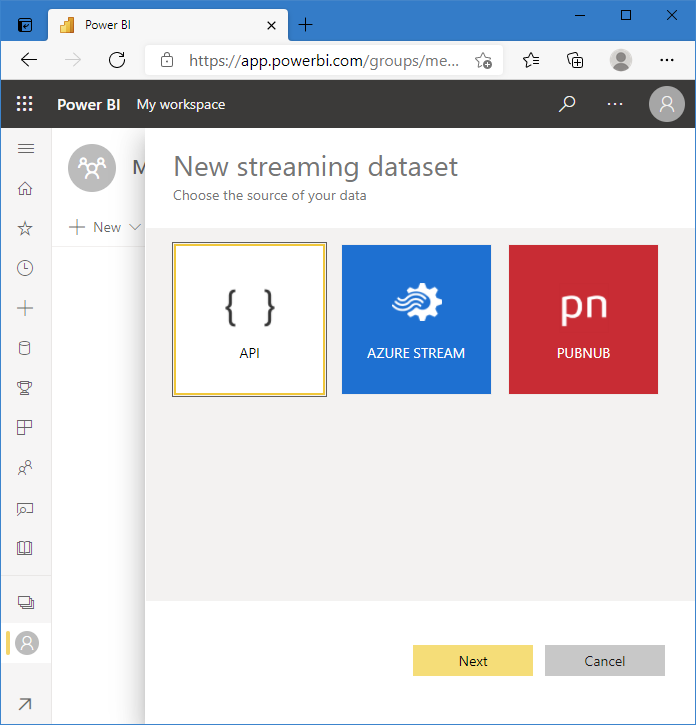
Select “API” for the new streaming dataset and click “Next”:
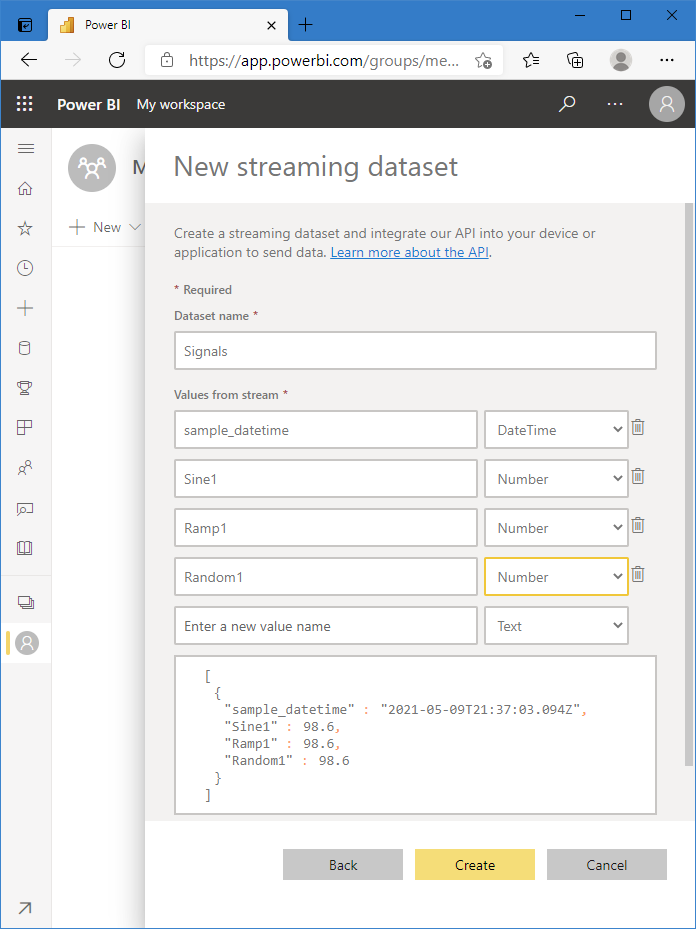
In this example, we will use the “sample_datetime” timestamp that is provided by the Power BI Connector. Add “sample_datetime” as a “DateTime” value. Add other values as “Number” values, with names corresponding to the configured tag names originating from the OPC UA Server. The streaming dataset configuration should look like this:
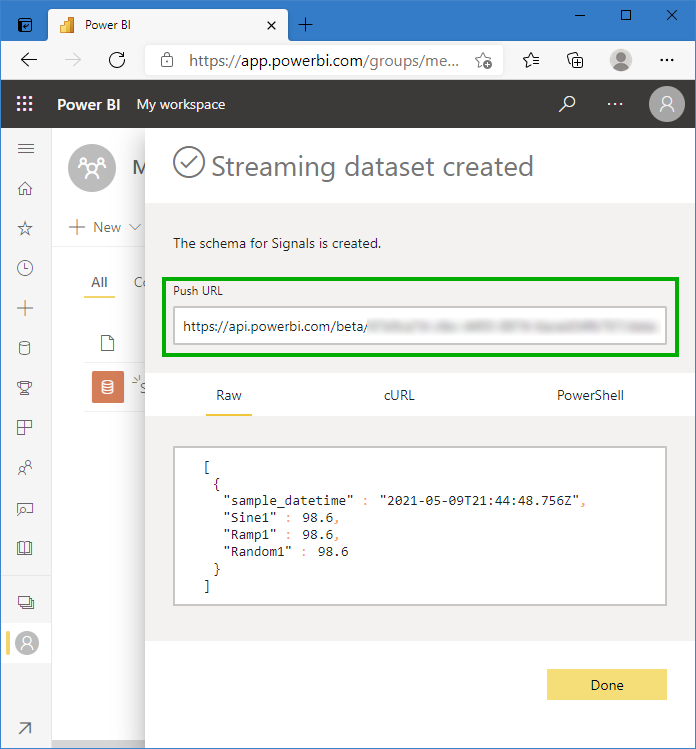
Click on “Create” to create the streaming dataset. Take note of the provided “Push URL” and click “Done”:
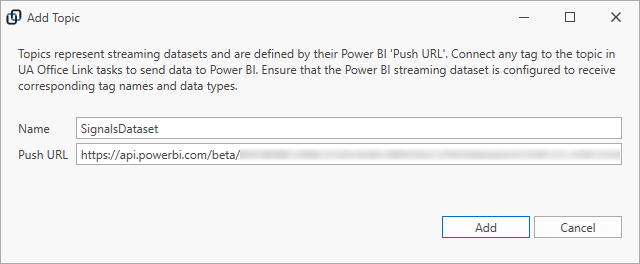
Add a topic in the Power BI Connector referencing the provided “Push URL”. In this example, we name the topic “SignalsDataset” but any other name will work as well.
Add a task to UA Office Link to send data to Power BI. Add the “Signals” OPC UA Connector topic and the Power BI Connector’s “SignalsDataset” topic to the task builder panel, then connect the topics. Connect the “Signals” topic connector to the “SignalsDataset”* topic connector (1) to generate tag connections (2).
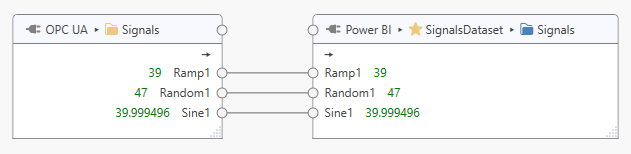
Start the task to begin sending data to Power BI. You should now see live values displayed within the topic, provided that “Live Values” are enabled in the main application’s “View” menu. If no live values are shown then inspect the message log to investigate possible causes.
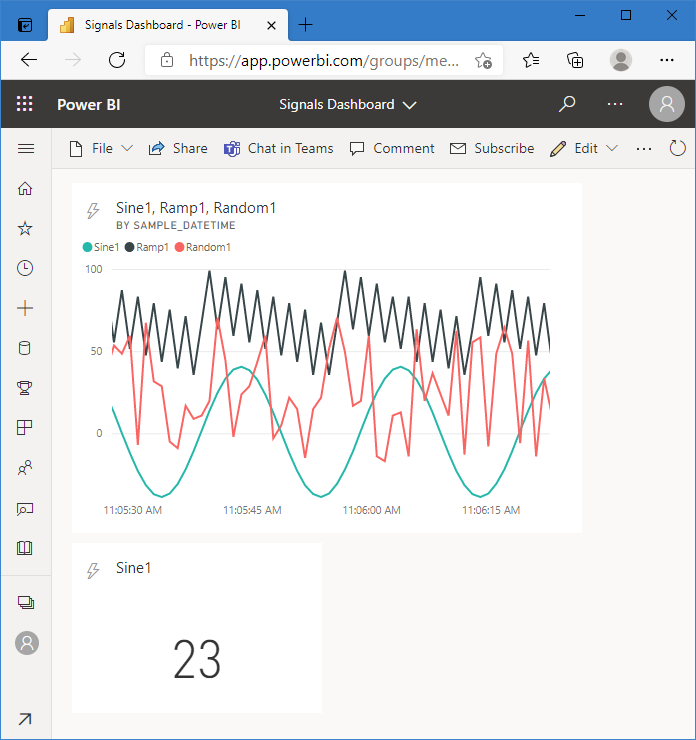
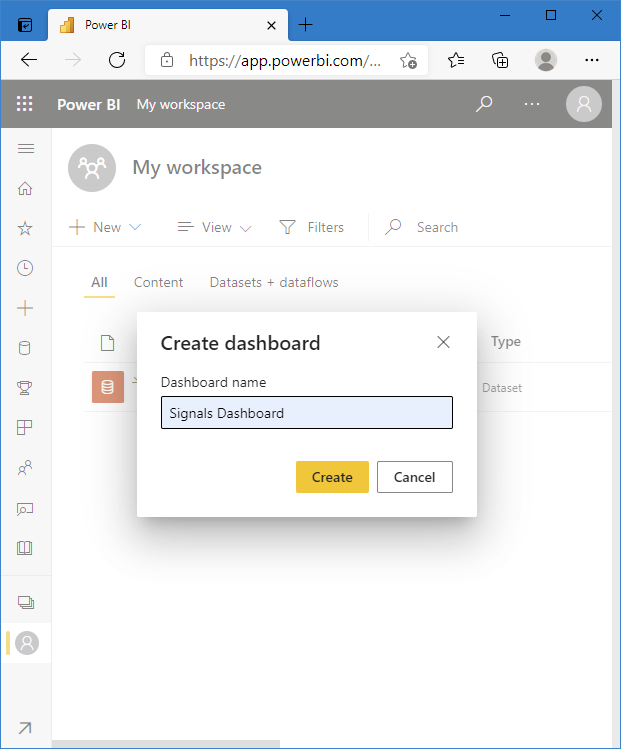
You can now begin adding dashboards and visuals to your Microsoft Power BI workspace. For example, in “My workspace”, select “New”, then “Dashboard” to create a new “Signals Dashboard”.
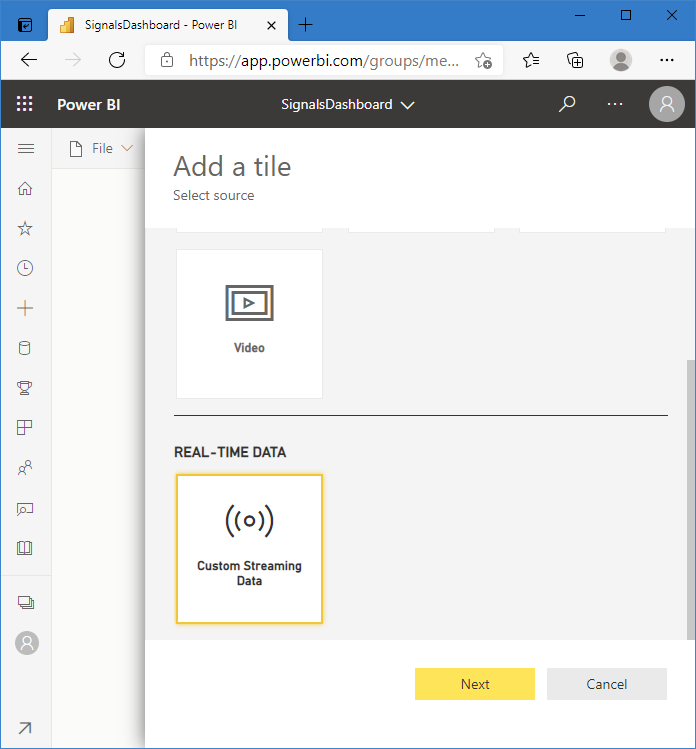
After the new dashboard is created, select “Edit” and “Add Tile” to add a visual representation of the “Signals” data. Select “Custom Streaming Data” from the list of the available options, then click “Next”.
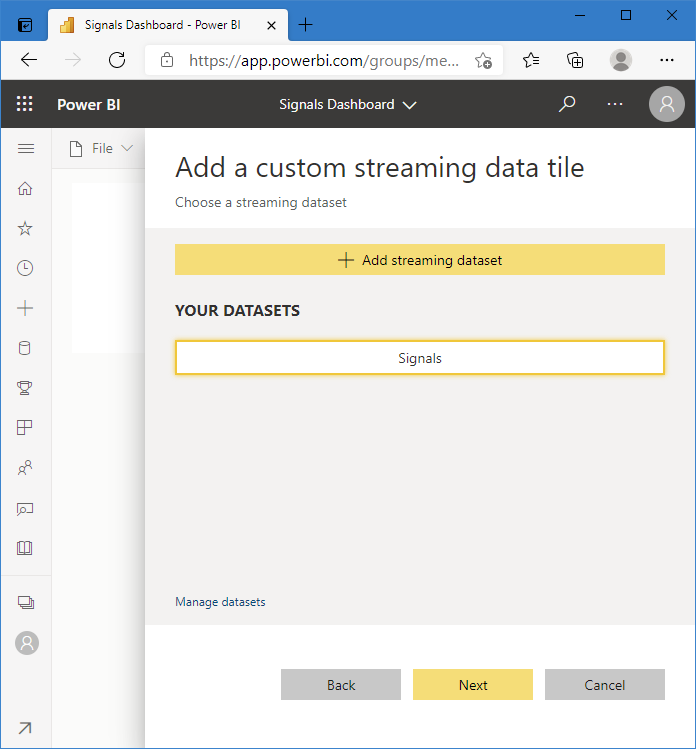
Select the “Signals” data set created earlier from the available datasets and click “Next”.
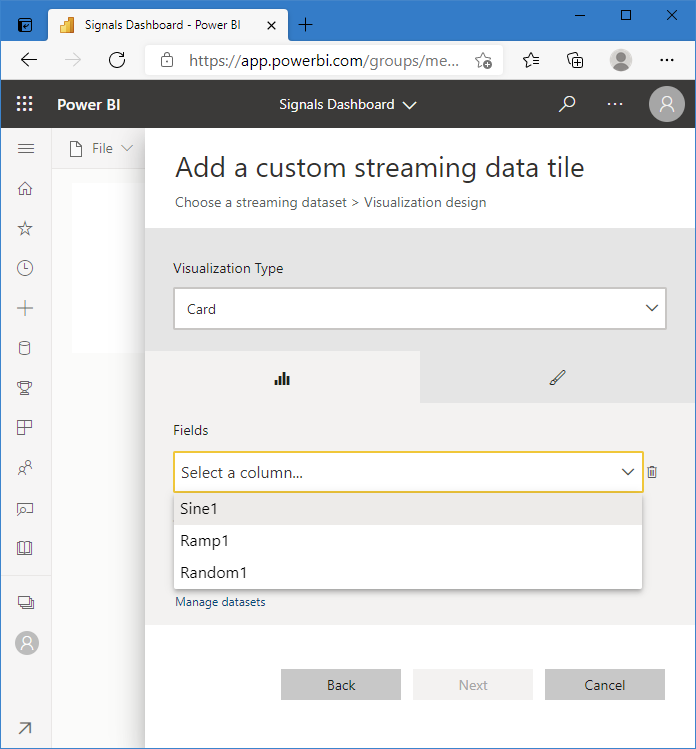
Select a visualization type and select fields to display from the drop down.
For charts where a timestamp is required, select “sample_datetime” as the axis value and add other values as required.
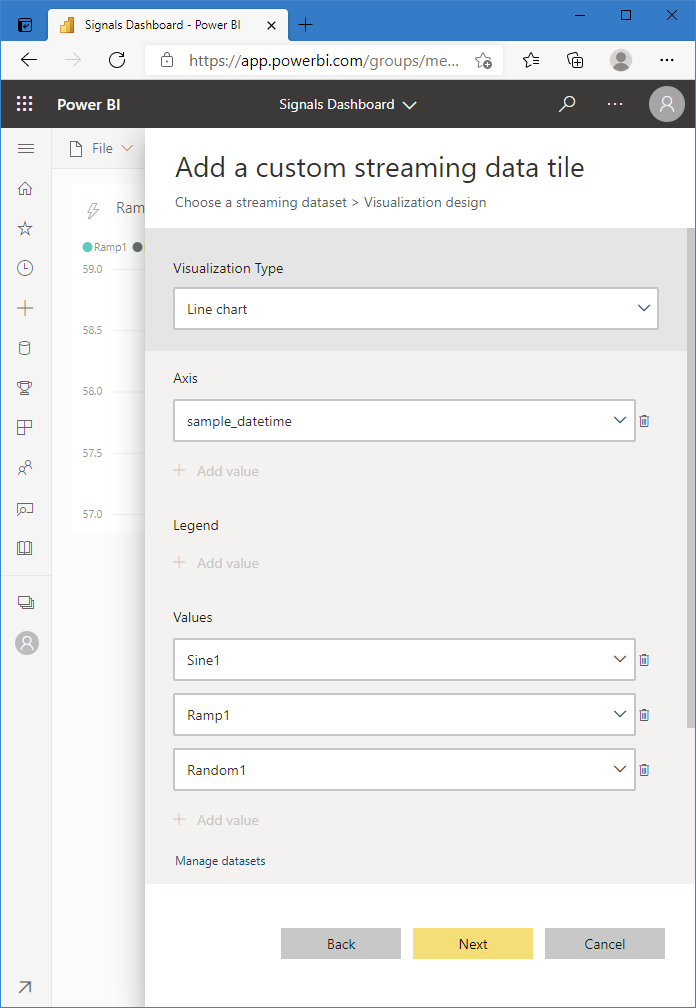
Note
In our experience live updates for charts do not immediately become visible in Power BI dashboards if multiple values are added to the chart at the time when the chart is created. Either create the chart first for display of a single value and then modify the task in a second step to add other values or logout of Power BI and sign in again after creating a chart displaying multiple values.
You should now see your dashboard updating in Power BI.